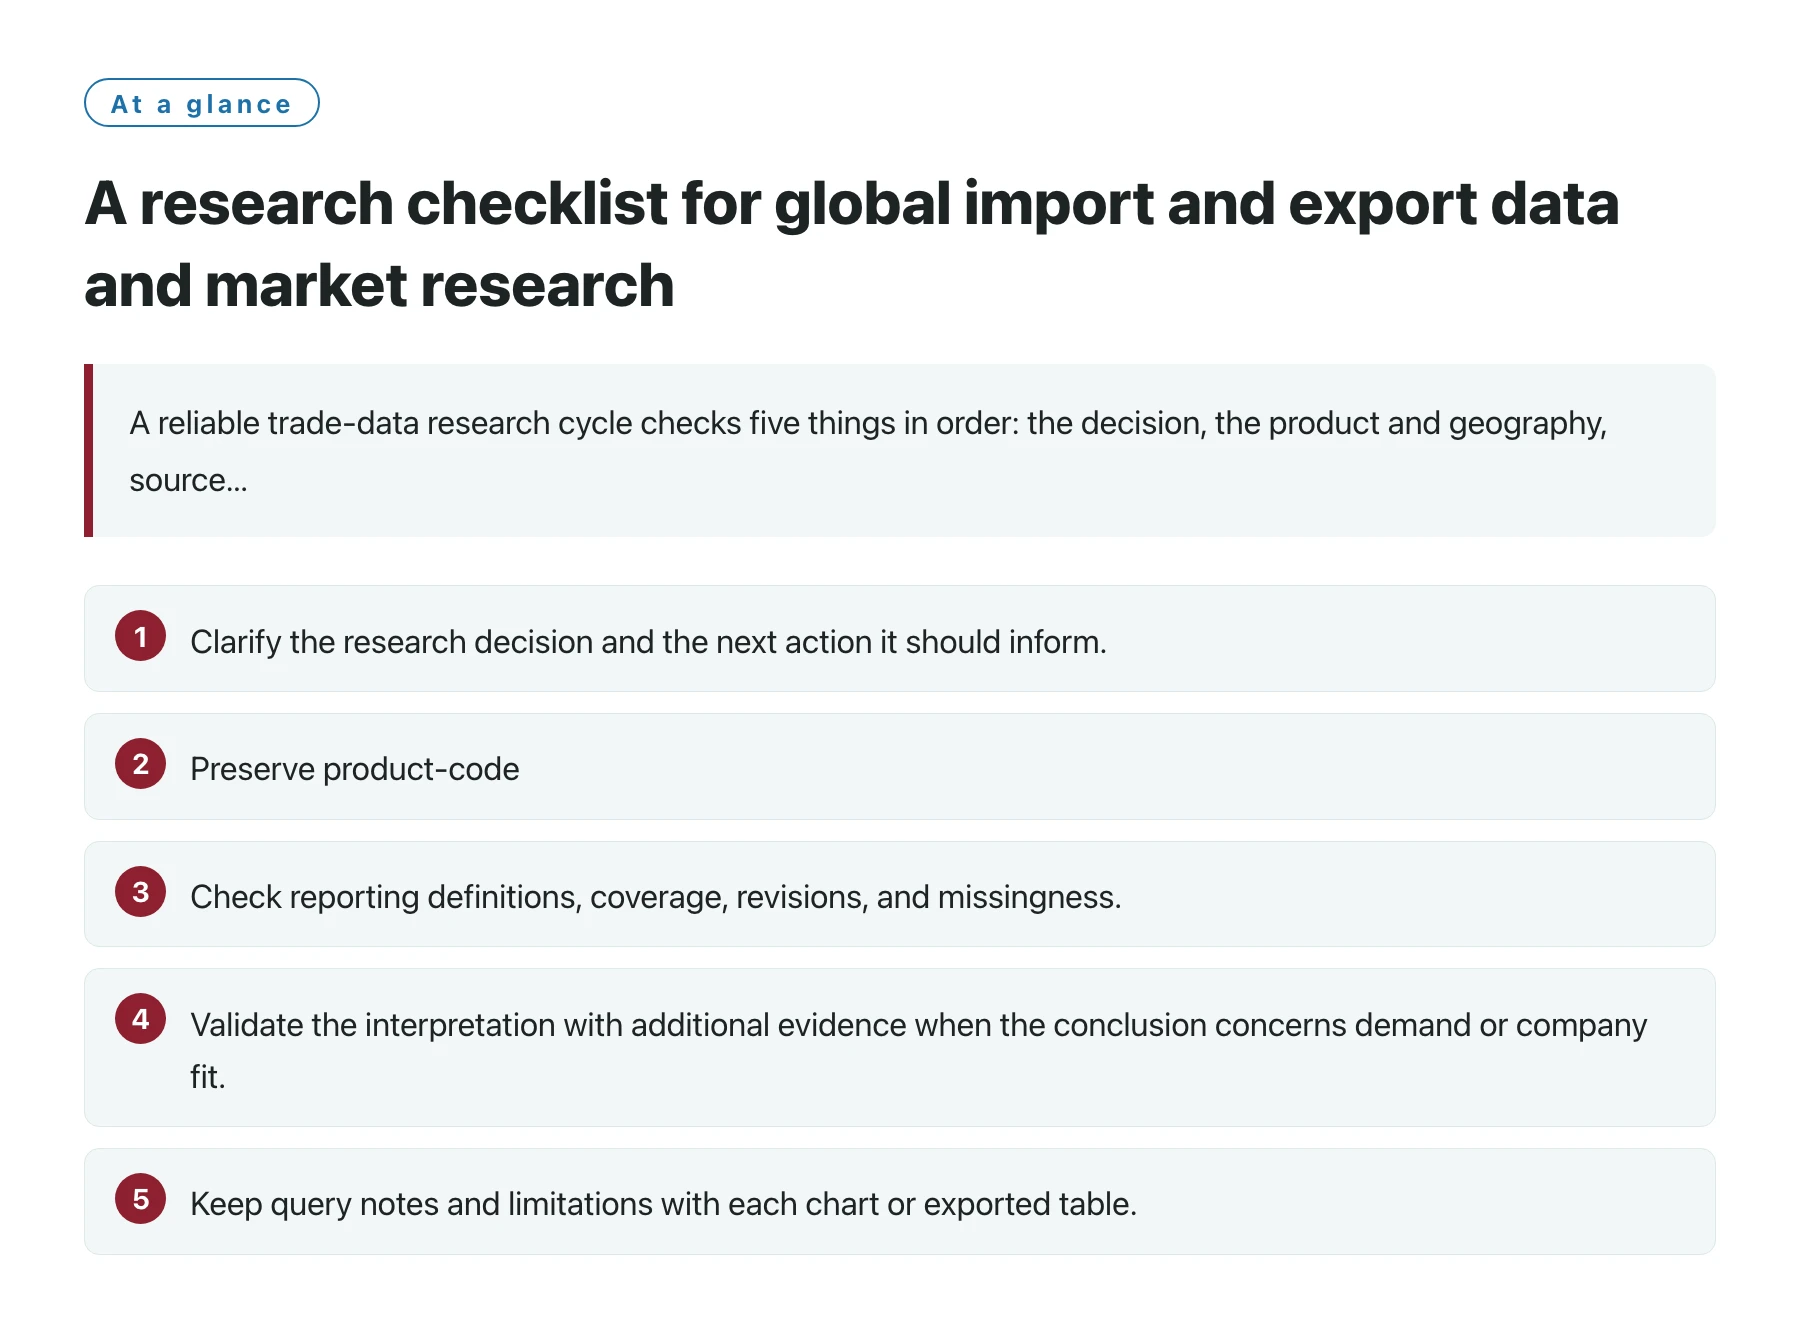
A reliable trade-data research cycle checks five things in order: the decision, the product and geography, source definitions, analytical consistency, and the limits of the conclusion. Working through those checks before writing recommendations makes the findings easier to reproduce and less likely to overstate what a trade record proves.
Key takeaways
- Clarify the research decision and the next action it should inform.
- Preserve product-code, reporter, partner, period, unit, and source details.
- Check reporting definitions, coverage, revisions, and missingness. [1]
- Validate the interpretation with additional evidence when the conclusion concerns demand or company fit.
- Keep query notes and limitations with each chart or exported table.
Checklists are useful when research includes several data sources or contributors. They make routine quality questions visible before those questions become errors in a market presentation. The list below is organized around the order in which an analyst should make decisions, so that product scope is stable before the analyst compares numbers.
The checklist does not require one particular software product. It applies to public statistics, commercial trade-data platforms, and internal extracts. Teams can turn it into a short review form and record “not applicable” where a check truly does not fit.
1. Scope checklist
- Name the decisionState who will act and what choice the research informs.
- Define the objectSpecify the product, service boundary if relevant, reporter, partner, flow, and date range.
- Set exclusionsList codes, geographies, record types, or periods that should not be included.
- Write a decision ruleDescribe what will trigger follow-up and what will be inconclusive.
2. Source checklist
For every source, record the publisher or provider, retrieval date, data product, and version if available. Identify whether the source reports customs movements, a statistical series, a company-oriented record, or an estimate. Save the documentation that explains the fields rather than relying on a screenshot of the results.
Check whether the source covers the geographies and time periods in the question. A source that is strong for one country may not cover another with equal detail. Confirm what happens to free zones, processing trade, warehouses, re-exports, and suppressed records where those concepts apply.
Trade series can use different systems and valuation conventions. WTO’s technical notes explain that general and special trade definitions differ in the treatment of certain movements, and that coverage or valuation choices affect comparability. Record the convention next to the extract. [1]
3. Product and geography checklist
Keep the commercial product name alongside every statistical code and official description. Note the code system, number of digits, revision, effective date, and why the code fits the product. If a category includes components or substitutes, state whether they are included and run an alternative definition when that boundary could change the conclusion.
For geography, state the role of every field. “Reporter” identifies the source economy; “partner” identifies the trading counterpart as represented by that source. A destination market, manufacturing origin, port, and customs territory can differ. Avoid renaming fields in a way that hides the original meaning.
If several countries are compared, identify the common classification level. National extensions can provide useful local detail but may not map directly to another country’s extensions. Preserve a separate crosswalk for each jurisdiction when necessary.
4. Data integrity checklist
Check that values use the same currency, scale, valuation basis, and period. Confirm quantity units before calculating growth or ratios. Keep missing observations separate from zero values, and flag suppressed data. If records are revised after extraction, note which version is used and preserve the retrieval date.
Look for breaks in continuity. Changes in code definitions, statistical territory, reporting thresholds, or collection procedures may change the series without a corresponding commercial event. Check the source notes for revisions and comparability warnings before interpreting a sudden jump or drop.
The U.S. Census Bureau’s international trade portal provides different resources organized by classification, geography, time series, and data products. A checklist should name the exact resource or table selected, because two downloads from the same agency can answer different questions. [2]
5. Analysis checklist
| Review question | Pass condition | If it does not pass |
|---|---|---|
| Is the comparison like-for-like? | Definitions, units, periods, and code levels are documented. | Separate the series or explain the remaining mismatch. |
| Could the result be a one-period anomaly? | More than one relevant period has been reviewed. | Use a wider window or qualify the conclusion. |
| Could product mapping drive the result? | A narrow and broader defensible mapping have been considered. | Show the sensitivity and seek classification advice. |
| Does a company match hold up? | Identity and activity are supported by independent evidence. | Keep the organization as an unverified research lead. |
| Can another analyst reproduce it? | The query, filters, source, and transformations are saved. | Complete the research log before presentation. |
A failed check does not automatically invalidate the research. It identifies where the conclusion needs qualification or another source.
6. Interpretation checklist
Separate what the source reports from what the analyst infers. A flow value is an observation under defined conditions. A claim about demand, growth, competitiveness, or supplier reliability is an interpretation and may require prices, customer evidence, operational checks, or additional data.
For company records, document how names were matched and how product descriptions were judged. A record may identify an organization to investigate, but it does not prove the entity’s current procurement plans, financial condition, or willingness to engage. Maintain a confidence note and verify the legal entity before outreach.
When the research needs searchable records and company exploration, trade data analytics can be considered as one platform category. Review coverage, sample data, field definitions, update practices, and terms for the task at hand. Do not infer that a feature is available for every market or every historical period without checking.
7. Reporting checklist
Every chart should show the product scope, geography, period, unit, source, and retrieval date. Include a short limitations note for missing observations, definition differences, revisions, broad codes, or uncertain entity matches. State the confidence level and what evidence would change the conclusion.
End with a next action. It may be a regulatory review, customer interview, distributor check, company identity review, or a refresh when new data is released. The action should follow directly from the evidence gap rather than from a general desire to collect more data.
Finally, archive the query and source documentation with the report. The market question may recur months later. A well-kept research log allows the team to refresh the work and determine whether the market changed or only the dataset and method did.
Sources
Frequently asked questions
What are the essential checks before comparing trade data?
Check the product definition, reporter and partner roles, flow direction, period, units, valuation, coverage, revisions, and missing observations.
Should a zero and a missing value be handled the same way?
No. A recorded zero, an unreported period, a suppressed value, and an unavailable field have different meanings.
Can trade data analytics establish demand by itself?
No. Trade flows can inform a market screen, but demand and commercial fit need additional evidence.
What makes an analysis reproducible?
A saved source, retrieval date, query, filters, product mapping, transformations, and a clear explanation of the interpretation.